5.1 Population & The Environment
A headline declared, “India Tops Chart for World’s Most Unhealthy Air,” highlighting findings from a study conducted by researchers from Columbia and Yale Universities (Timmons and Vyawahare 2012). The study revealed that India possesses the highest levels of air pollution globally, particularly in terms of fine particulate matter, which surpass safe thresholds for human health by nearly fivefold. A representative from an environmental organization in India attributed this concerning air quality to the proliferation of motor vehicles. Despite having fewer vehicles per capita compared to affluent nations, India’s vehicles significantly contribute to pollution due to their high emission rates, exacerbated by the country’s large population. Emphasizing India’s lax emission regulations, the spokesperson advocated for more stringent standards, warning of the dire consequences if substantial measures are not promptly implemented: “We must take significant strides forward, or else the magnitude of the issue will become insurmountable.”
This news story highlights the global challenge of air pollution. It underscores that India’s large population, ranking second globally with 1.2 billion people, is a significant factor contributing to its air pollution issue, following closely behind China. India’s situation illustrates how population size can intertwine with environmental concerns.
Theoretical Perspectives
The theoretical perspectives in sociology provide valuable insights into understanding topics concerning population growth and the environment. Table 12. “Theory snapshot on population and the environment,” outlines their key ideas and viewpoints for easy reference.
Table 12. Theory snapshot on population and the environment
|
Theoretical Perspective |
Major Assumptions |
|---|---|
| Functionalism | Population and the environment affect each other. Normal population growth is essential for any society, but population growth that is too great or too little leads to various problems. Environmental problems are to be expected in an industrial society, but severe environmental problems are dysfunctional. |
| Conflict theory | Population growth is not a serious problem because the world has sufficient food and other resources, all of which must be more equitably distributed. The practices of multinational corporations and weak regulation of these practices account for many environmental problems. |
| Symbolic interactionism | People have certain perceptions and understandings of population and environmental issues. Their social backgrounds affect these perceptions, which are important to appreciate if population and environmental problems are to be addressed. |
Source: University of Minnesota Libraries. 2016. Social Problems: Continuity and Change. Minneapolis, MN: University of Minnesota Libraries Publishing.
Functionalism views population growth, including its components like birth, death, and migration, as natural and necessary for any society’s functioning. Losing members jeopardizes a society’s survival, while growth enables it to thrive and tackle future challenges. Functionalism also acknowledges pollution and environmental issues as inevitable outcomes of modern society, but excessive problems are deemed harmful.
The significance of population growth varies depending on the society’s economy. Agricultural and nonindustrial societies rely on high birth rates to offset high death rates, while industrial societies need a steady influx of younger workers to replace retirees and sustain new industries. However, rapid and extreme population growth can strain resources, cause crowding, and harm the environment.
Functionalism highlights the interplay between population and the environment. Population growth contributes to environmental problems, while environmental issues impact entire populations and even global communities. Conversely, some industrial nations face challenges due to insufficient population growth, leading to workforce shortages and tax revenue concerns. Thus, both excessive and inadequate population growth pose problems.
Conflict theory views population growth differently from other perspectives. It argues that the world has enough resources to support its growing population, but problems like food shortages occur because powerful groups in poor countries make decisions that keep resources from reaching everyone. Multinational companies also play a role by exploiting natural resources in these countries. So, according to conflict theory, the issue isn’t that there’s not enough food or resources, but rather that they’re not shared fairly. To address this, efforts should focus on making sure resources are distributed more equally instead of just trying to limit population growth.
However, conflict theory also recognizes that in many poor countries population growth is too high. It blames this on governments not making birth control easily available and not doing enough to educate and empower women, which can lower birth rates. When it comes to a specific population issue like immigration, conflict theory highlights the role of racism and discrimination. It supports making immigration to the United States easier and giving undocumented immigrants a path to citizenship if they want it. Additionally, conflict theory argues that environmental problems aren’t inevitable. It says that big companies pollute the environment, and governments like the United States don’t have strong enough rules to stop them or make them follow the rules they do have.
Symbolic Interactionism provides four perspectives on how we understand population and environmental issues. Firstly, it considers why individuals choose to participate or not in activities related to population growth, contraception use, or environmental actions like recycling. To effectively tackle these problems, it’s crucial to grasp the motivations behind people’s involvement or lack thereof.
Secondly, it focuses on how people perceive population and environmental challenges. Since public attitudes significantly impact the persistence of these issues, it’s vital to comprehend the reasons behind these views to better direct problem-solving efforts.
Thirdly, symbolic interactionism suggests that population and environmental issues are partially socially constructed. These problems only gain recognition as societal concerns when enough people or influential organizations acknowledge them. For instance, lead poisoning was identified as a health hazard long before governmental action was taken. Despite scientific evidence, industries insisted on lead’s safety until environmental groups and overwhelming evidence forced regulatory changes.
Lastly, symbolic interactionism highlights how individuals from diverse social and cultural backgrounds may have varying understandings of population and environmental matters. For instance, someone from a rural background might perceive even a small city as overcrowded, while someone from an urban setting might find smaller cities lacking in amenities compared to larger ones.
Population Growth
Population changes carry significant implications for societies. While we often focus on the challenges of population growth, it’s important to recognize the impact of population decline as well. Take Michigan, for instance (Dzwonkowski 2010). Like many other northern states, Michigan has seen a decrease in its population over the past few decades. This decline is coupled with a 21 percent drop-in birth rates since 1990, leading to shrinking elementary school populations and closures of several schools. Moreover, more people are leaving Michigan than moving in, particularly young, college-educated adults, resulting in a drain on the state’s economy and tax base.
Due to population decline, Michigan’s demographics are shifting towards an older population, straining state services geared towards elderly residents. This trend has far-reaching effects, impacting the economy, education system, and social services. Meanwhile, states in the southern and western regions of the U.S. are experiencing population growth, which brings its own set of challenges. Growing cities face overcrowded schools, stretched healthcare facilities, and increased demand for social services.
These issues of population change are not unique to the U.S. but are global phenomena. In the following sections, we will discuss the study of population and explore these challenges in greater detail.
The study of population
We’ve noted that changes in population play a crucial role in shaping broader societal changes. In sociology, the study of population dynamics holds such significance that it has its own specialized branch known as demography. Essentially, demography investigates shifts in population size and composition. This field covers various key concepts, including fertility and birth rates, mortality and death rates, as well as migration. Let’s briefly explore each of these.
Fertility essentially refers to the number of live births occurring within a population. Demographers utilize different measures to assess fertility levels. One common measure is the crude birth rate, which indicates the number of live births per 1,000 individuals in a population within a given year. It’s called ‘crude’ because it considers the entire population, not solely women or women within childbearing age (typically 15–44 years old).
Another measure is the general fertility rate, also known simply as the fertility rate or birth rate, which denotes the number of live births per 1,000 women aged 15–44 (the age range commonly associated with childbearing). For instance, in 2010, the general fertility rate in the US was approximately 64.7, indicating 64.7 births per 1,000 women aged 15–44 (Sutton and Hamilton 2011).
Another factor to consider is the total fertility rate, which represents the average number of children a woman is anticipated to have during her lifetime. This statistic takes into consideration variations among women. Some have more children while others have fewer or none at all. This measure is frequently discussed in the media and is generally easier for the public to grasp compared to the previous two measures. For example, in 2010, the total fertility rate in the United States stood at approximately 1.93, meaning there were around 1,930 births for every 1,000 women (Hamilton et al. 2011).
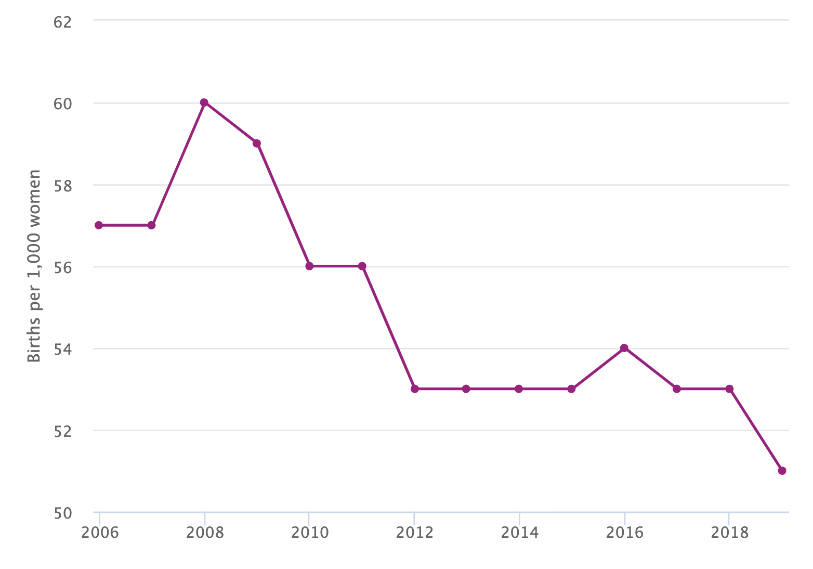
As Figure 8. “U.S. General Fertility Rate, 2006-2019″ shows, the fertility rate in the United States has undergone significant changes over the past century. The General Fertility Rate (GFR) is a measure that tells us how many babies are born per 1,000 women of reproductive age. It’s a simple way to understand fertility levels at a given time (Erbabian, Osorio, and Paulson 2022). However, changes in the age distribution of the population can affect the GFR. For example, if more women are over 40, the GFR tends to drop. In 2008, the GFR hit 60 births per 1,000 women but then fell, reaching 51 births per 1,000 women in 2019. This decline suggests that women in their 40s are having fewer children in recent years.
Figure 8. U.S. General Fertility Rate, 2006-2019
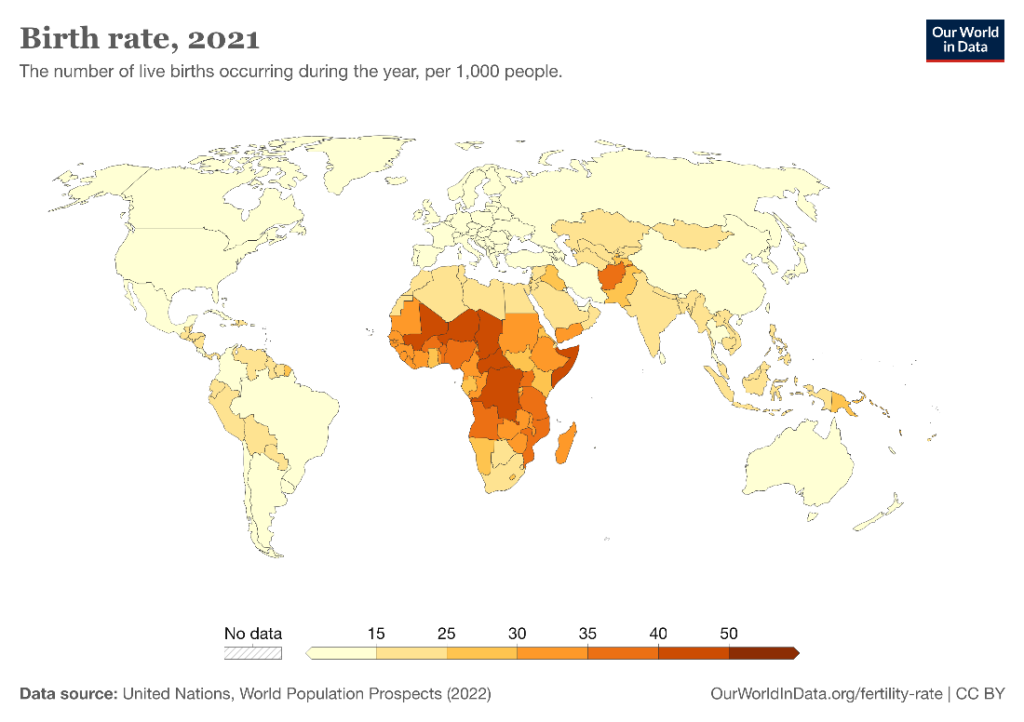
Fertility rates vary globally, with notably high rates observed in economically disadvantaged countries (refer to Figure 9. “Crude birth rates around the world, 2021” depicting the number of births per 1,000 population). Experts in population studies, known as demographers, pinpoint several factors contributing to these elevated rates (Weeks 2012).
To begin with, many low-income countries rely heavily on agriculture. In such societies, having more children is seen as advantageous for families, as they are considered valuable economic assets that can contribute to the productivity of agricultural work. Second, infant and child mortality rates tend to be elevated in these regions. Due to the fear of losing children prematurely, parents often choose to have more offspring to compensate for the potential losses.
A third factor stems from the preference for sons over daughters in many low-income societies. When a daughter is born, parents may try for additional children in the hope of having a son. Moreover, traditional gender norms are deeply entrenched in these communities, often emphasizing women’s roles as wives and mothers above all else. As a result, women may feel societal pressure to have multiple children. Lastly, access to contraception is limited in many low-income nations, leading to higher rates of unplanned pregnancies and births. Collectively, these factors contribute to the higher fertility rates observed in low-income countries compared to wealthier nations.
Figure 9. Crude birth rates around the world, 2021
Mortality refers to the number of deaths in a population. Demographers use the crude death rate to measure it, which is the number of deaths for every 1,000 people in a population in a given year. We call it “crude” because it doesn’t consider the age distribution of the population. A society with more older people typically has a higher crude death rate. Demographers often adjust for age distribution when calculating age-adjusted death rates.
Migration is the movement of people into and out of specific regions. Throughout history, people have migrated to seek a better life due to conflicts or forced migration like the slave trade.
There are different types of migration. When people move into a region, it’s called in-migration or immigration; when they move out, it’s called out-migration or emigration. The in-migration rate is the number of people moving into a region per 1,000 people already there, while the out-migration rate is the number of people leaving per 1,000 people. The net migration rate is the difference between the two (in-migration minus out-migration). For example, Michigan has had a net migration less than zero because more people have left than moved in.
Migration can occur within a country (domestic) or across countries (international). Domestic migration refers to people moving within a country, like when retired individuals from the northeastern United States relocate to places like Florida or the Southwest. International migration, on the other hand, involves crossing national borders. Heavy international immigration can significantly affect population growth and various aspects of national life; sometimes it leads to increased prejudice against newcomers. Domestic migration can also bring about significant changes. For instance, the mass movement of African Americans from the South to northern cities in the first half of the twentieth century had profound effects on those cities. Similarly, the recent trend of people from northern regions moving to the South and Southwest has had notable impacts, such as a surge in the housing market and increased traffic (Wilkerson 2011).
Now that you understand some basic demographic concepts, let’s look into population change further. Three main factors influence changes in population size: fertility (crude birth rate), mortality (crude death rate), and net migration. The natural growth rate is simply the difference between the crude birth rate and the crude death rate. In the U.S., the natural growth rate is approximately 0.6 percent per year, meaning about 6 per 1,000 people. When we consider immigration as well, the total population growth rate has been close to 1.0 percent per year (Rosenberg 2011).
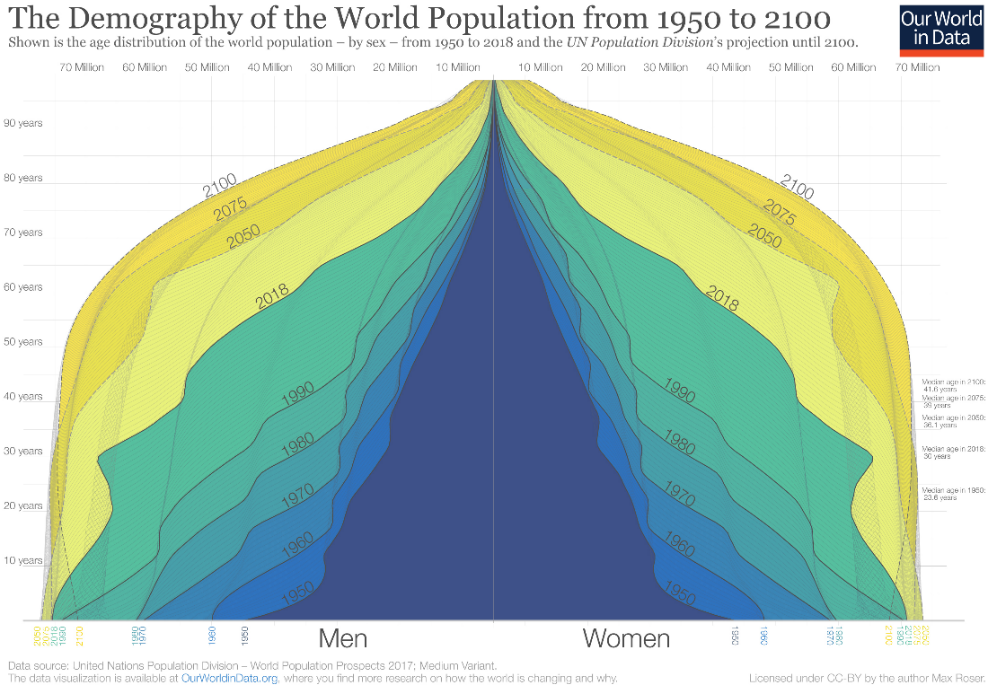
Figure 10. “Demography of the world population from 1950 to 2100” illustrates how global population by sex has changed and what we can expect for the 21st century. When comparing 1950 to 2018, we observe an increase in the number of children born, from 97 million to 143 million, alongside a decrease in child mortality. However, when comparing the population pyramid base in 2018 to the projected figures for 2100, it becomes evident that future decades will diverge from the past. Projections indicate a decrease in the number of children born by the end of the century, resulting in a narrower base for the future population structure (Roser 2019).
Figure 10. Demography of the world population from 1950 to 2100
To find out how long it takes for a country to double its population, you can use a simple calculation. Divide the number 70 by the population growth rate of the country. For instance, if a country has a yearly growth rate of 3 percent, it will take about 23.3 years (70 ÷ 3) for its population to double. Looking at the map in Figure 3. “Demography of the World Population from 1950 to 2100,” you’ll notice that several countries are expected to double their population size within this timeframe if their current growth rates persist. For these countries, managing population growth will become a significant challenge if resources like food are not distributed adequately.
Demographers study factors like birth rates, death rates, and migration patterns to predict how populations will change over the coming decades. By combining this knowledge with historical population data, we can understand long-term population trends. One important trend is that as societies grow larger, their populations tend to grow faster. Initially, when a society is small, population growth is slow because there are fewer adults having children. But as the population increases, so does the number of adults, leading to more births each generation and rapid population growth.
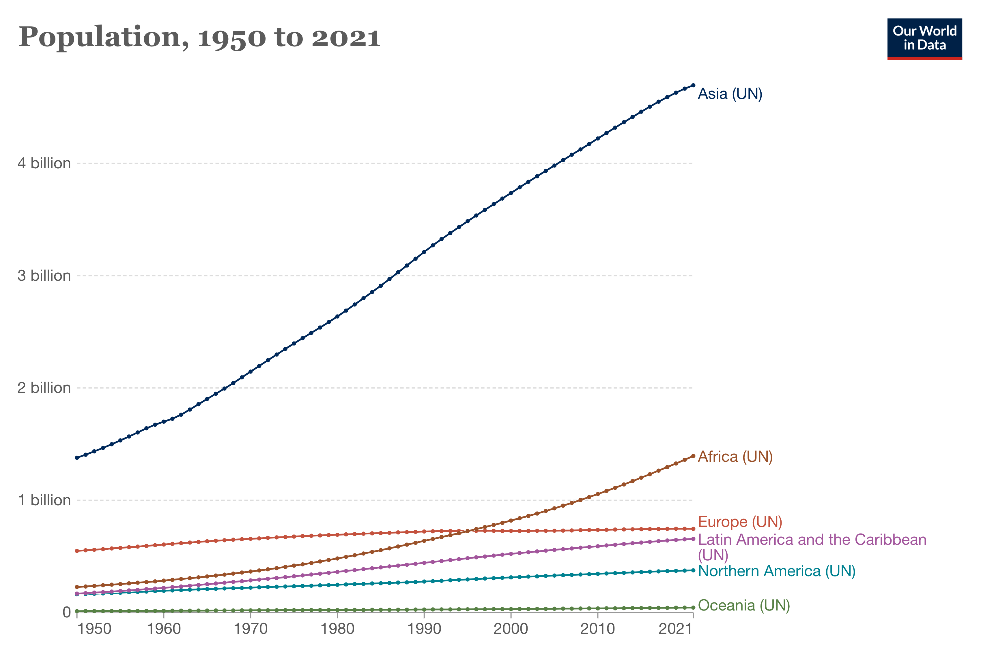
We can see this trend throughout history. Around 12,000 years ago, when agricultural societies first emerged, the global population was only about 8 million. It grew to around 300 million about 2,100 years ago and reached about 500 million by the fifteenth century. By 1850, it had doubled to 1 billion, then doubled again to 2 billion by 1950. In just fifty more years, it tripled to over 6.8 billion, and projections suggest it will exceed 9 billion by 2050 (refer to Figure 11. “World population, 1950–2021”) and 10 billion by 2100 (Gillis and Dugger 2011).
Figure 11. World population, 1950–2021
Over time, the rate at which the world’s population grows starts to slow down after a period of rapid increase, as explained by demographic transition theory. This trend is illustrated in the lower section of Figure 11. “World population, 1950–2021,” which displays the average yearly growth rate of the global population. This rate has been decreasing over recent decades and is predicted to continue declining for the next four decades. Essentially, although the world’s population will keep growing in the foreseeable future, the rate of growth will gradually decrease over time. As indicated in Figure 10. “Demography of the world population from 1950 to 2100” the growth that does occur will mainly happen in impoverished nations in Africa and some other regions. Nonetheless, even in these countries, the average number of children per woman has dropped from six in the past generation to about three today.
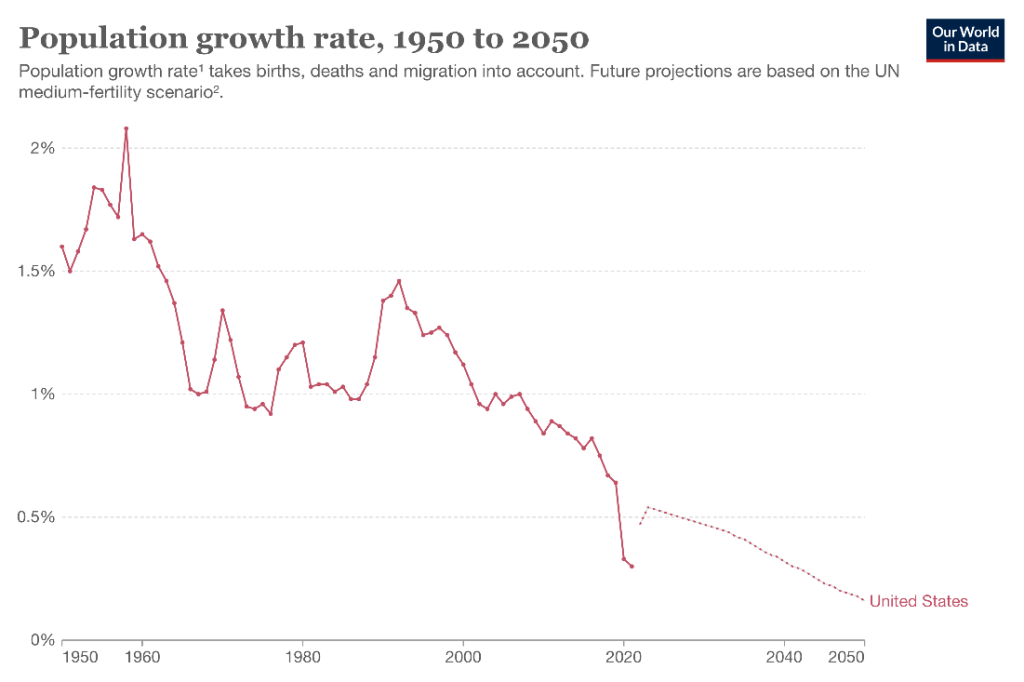
Figure 12. “Past and projected size of the U.S. population, 1950–2050,” provides insights into the historical and expected future sizes of the U.S. population. Population growth is expected to decrease from 2023 to 2053, with an average annual growth rate of 0.3 percent during this time. Immigration will play a larger role in driving this growth, as fertility rates are projected to remain below the level needed for natural replacement without immigration (Congressional Budget Office 2023).
Figure 12. Past and projected size of the U.S. population, 1950–2050
Population growth perspectives
The numbers we’ve just reviewed reveal something pretty astounding; the populations of both the United States and the world have shot up dramatically in just a few hundred years. It’s no wonder that people during this time have been concerned about population growth, particularly the idea of overpopulation. One of the early voices to raise alarm about population growth was Thomas Malthus (1766–1834), an English economist. He suggested that populations grow exponentially (like 2, 4, 8, 16, 32, 64, 128, 256, 512, 1024…). If you keep going with that list, you’ll see how quickly it gets really big in just a few “generations.”
Malthus, in his work published in 1798, argued that while populations grow rapidly, food production only increases linearly (like 1, 2, 3, 4, 5, 6…). He believed that food production wouldn’t be able to keep pace with the growing population, leading to widespread starvation.
By the 1970s, population growth became a big concern in the United States and some other countries. You might have heard the term “Zero Population Growth,” or ZPG, thrown around. People were really worried about the fast-growing population, both in the U.S. and globally, fearing that our planet couldn’t handle such a huge number of people. Some predictions even warned of serious food shortages by the end of the century.
Luckily, Malthus and those advocating for ZPG were somewhat off the mark. While population levels have definitely skyrocketed, the projections in “World Population, 1950–2021” (see Figure 4) show that the rate of increase is actually slowing down. Thanks to various factors, like better contraception methods—especially the birth control pill—population growth has been curbed, not only in wealthier countries but also increasingly in poorer nations. Additionally, food production has increased much more than Malthus and ZPG advocates foresaw.
The debate on overpopulation
Many experts are worried about overpopulation because they believe it directly leads to hunger and malnutrition affecting millions of people in poorer countries (Gillis 2011). One expert put it simply: “Every billion more people makes life more difficult for everybody—it’s as simple as that. Is it the end of the world? No. Can we feed 10 billion people? Probably. But we obviously would be better off with a smaller population” (Gillis and Dugger 2011: A1). Recognizing this issue, India has started providing cash bonuses to poor, rural married couples, who typically have many children, to delay having more children, and it has increased its promotion of contraception (Yardley 2010).
However, some experts argue that the world has enough resources and downplay the issue of overpopulation. They recognize the presence of widespread hunger in Africa and other areas but attribute it not to overpopulation or lack of food, but rather to difficulties in distributing the existing amount of food. An official from Oxfam International explained, “Today’s major problems in the food system are not fundamentally about supply keeping up with demand, but more about how food gets from fields and on to forks” (King 2011). They noted that there is plenty of grain like cereal and soy available to feed the world, but a significant portion of it is used as animal feed rather than for direct human consumption. Transitioning away from diets heavily reliant on meat consumption could free up more grain to address hunger among the world’s poor.
Sociologists Stephen J. Scanlan and his colleagues also argue that food scarcity is more a result of unequal food distribution rather than overpopulation: “[Food] scarcity is largely a myth. On a per capita basis, food is more plentiful today than any other time in human history…Even in times of localized production shortfalls or regional famines there has long been a global food surplus…A good deal of thinking and research in sociology…suggests that world hunger has less to do with the shortage of food than with a shortage of affordable or accessible food. Sociologists have found that social inequalities, distribution systems, and other economic and political factors create barriers to food access” (Scanlan et al. 2010:35).
This sociological perspective has significant implications for addressing global hunger. Traditionally, organizations like the World Bank and various United Nations agencies have believed that hunger results from a lack of food, leading them to focus on boosting food production and distribution efficiency through new technologies and methods. However, this view overlooks social factors.
According to Scanlan et al. (2010), global hunger isn’t solely due to food scarcity. Instead, it’s influenced by social inequalities that restrict access to food, particularly in poorer nations. For example, these nations often lack the financial resources to import available food. Poverty is one key factor contributing to this, but gender and ethnic disparities also play significant roles. Nations with higher levels of gender and ethnic inequality tend to experience more hunger. Given these insights, Scanlan et al. (2010) argue that “International attention to food security should therefore shift from increasing food supply to regulating armed conflict, improving human rights, and promoting gender equity throughout the world—factors that reduce barriers to access and empower populations throughout the world to benefit from their food entitlements.”
Demographic transition theory
When we think about whether overpopulation is as big of a problem as Malthus and modern scientists say, it’s crucial to understand demographic transition theory. Remember we talked about this theory before? It basically connects how fast a population grows to how technologically advanced a society is, dividing it into three stages of development. It suggests that population growth slows down a lot as countries become more industrialized.
In the first stage, which corresponds to preindustrial societies, both the birth and death rates are high. This is because there is limited access to contraception and many health issues. However, because the high birth rate is balanced by the high death rate, there isn’t much population growth.
In the second stage, as societies become more industrialized, the death rate decreases due to advancements in food production, sanitation, and medicine. However, the birth rate remains high because people still value large families and contraception may not be widely available. This leads to a significant increase in population.
In the third stage, the death rate remains low, but the birth rate starts to decrease. Families realize that having many children is more challenging in an industrialized society. Additionally, contraception becomes more accessible. As a result, population growth slows down, and in some industrialized nations, it even declines.
Demographic transition theory offers a reason to cautiously hope about overpopulation. It suggests that as less developed countries modernize, like industrial nations did two hundred years ago, their population growth rates should decrease. However, population growth rates in these countries remain high. Gender and ethnic inequality contribute to widespread hunger, with hundreds of thousands of women dying each year in poor nations during pregnancy and childbirth. Educated women with higher incomes typically have fewer children.
Population decline and pro-natalism
While population growth is still a concern in poorer countries, some wealthier nations are facing a different issue: population decline. This means that in these countries there are fewer people being born than there are dying. By the year 2050, it’s expected that more countries will see their populations decreasing (Brooks 2012). To keep a population steady, on average, each woman needs to have 2.1 children. However, many industrialized nations, except for the United States, are falling below this level. This is happening because more women are using birth control and also because many women are choosing to stay in school longer, start working after finishing school, and delay having their first child.
Interestingly, the declining populations in these countries are starting to worry experts who study population trends and the people who make decisions about policies (Haartsen and Venhors 2010). In many industrialized countries, people are living longer lives, but there are fewer babies being born. This means that there are more elderly people compared to younger people. In some European countries, there are more people over 61 years old than under 19. As this continues, it could become harder to take care of the health and financial needs of so many older people. Plus, there might not be enough younger people to fill all the jobs and provide the services that a modern society needs. With a smaller workforce, governments might also collect less money in taxes, which could make it even harder to pay for these services.
To address these issues, many governments have started pro-natalist policies to encourage women to have more children. Pro-natalist policies are government initiatives and programs designed to encourage higher birth rates and support families in having children. These policies are implemented with the aim of addressing concerns related to declining birth rates, aging populations, and potential negative economic consequences associated with low fertility rates. Pro-natalist policies can take various forms, including financial incentives such as tax breaks, cash payments, or subsidies for childcare and parental leave, as well as offering family-friendly workplace policies and access to affordable housing. Additionally, pro-natalist campaigns may include educational initiatives promoting the benefits of parenthood and larger families. The overarching goal of pro-natalist policies is to increase the number of births within a society to ensure demographic stability and support future economic growth.

Several countries have implemented pro-natalist policies to address declining birth rates and aging populations. Some countries give cash directly to couples when they have another child. For example, Russia sometimes gives around $9,000 for each child after the first one, and Spain offers €2,500 (about $3,400) for each child. (Haub 2009). Here are additional examples of countries with pro-natalist policies and a brief overview of their initiatives:
- France has one of the most comprehensive pro-natalist policies globally. Its policies include financial incentives such as monthly child benefits, tax breaks for families with children, subsidized childcare facilities, and parental leave allowances. France also promotes work-life balance through shorter working hours and flexible schedules for parents.
- Facing low birth rates and an aging population, Singapore has implemented various pro-natalist measures. These include cash incentives for parents, subsidized healthcare and childcare services, housing grants for families with children, and extended maternity and paternity leave.
- Sweden offers generous parental leave policies, allowing parents to take up to 480 days of leave per child with a significant portion of the leave being paid. The country also provides affordable childcare options, financial support for families with children, and access to subsidized healthcare and education.
- South Korea has introduced pro-natalist policies to combat its low birth rate and aging population. These include cash incentives for parents, subsidized childcare services, housing support for families with children, and measures to promote work-life balance such as flexible working hours and parental leave.
- Hungary has implemented pro-natalist policies aimed at boosting birth rates and supporting families. These policies include financial incentives such as tax breaks for families with multiple children, subsidized childcare services, housing benefits, and loan programs for young couples.
These are just a few examples of countries with pro-natalist policies, and the specific initiatives may vary in scope and effectiveness depending on the country’s demographic challenges and socio-economic context.
Additional population growth problems
As we’ve explored, experts in population studies often discuss how population growth impacts global poverty and hunger. However, there’s widespread acknowledgment that population growth also contributes to two other significant global issues.
One of these concerns relates to the environment. Whether in affluent or impoverished nations, the increasing population has led to environmental degradation in various forms (Walsh 2011). For instance, countries with large populations heavily rely on motor vehicles, which contribute to air pollution. Also, both developed and developing nations pollute the air, water, and soil. Furthermore, as human populations have expanded, extensive deforestation has occurred worldwide. This destruction of forests disrupts animal habitats and exacerbates global warming because trees play a crucial role in absorbing carbon dioxide and releasing oxygen into the atmosphere.
Another issue is interpersonal conflict, including armed conflict. As populations grow, the demand for food, water, and resources escalates. Historically, when resources have become scarce, societies have resorted to acquiring them from others through forceful means, as the saying goes, “by any means necessary” (Buhaug, Gleditsch, and Theisen 2008). Population growth contributes to armed conflicts between societies and within societies themselves. As communities expand, competition for resources intensifies, often leading to various forms of hostility, including interpersonal violence. The history of immigration in the United States serves as an example; where rapid increases in immigrant populations triggered perceptions of threats among native-born Whites, resulting in instances of mob violence.
Population growth contributes to conflicts both between different societies and within a single society. As a society expands, competition for resources intensifies, often leading to various forms of hostility, including interpersonal violence. The history of immigration in the United States provides a clear example of this phenomenon. During periods of rapid immigration, native-born Whites perceived immigrants as threats to their jobs, land, and other resources, prompting violent reactions such as mob violence.
Immigration
Remember that migration and immigration are important topics when studying populations. As we’ve just mentioned, immigration often sparks heated debates in the United States and other countries. This is because the arrival of more immigrants can impact various parts of a society, such as making cities more crowded, increasing the number of students in schools, and potentially affecting job availability. However, it’s crucial to understand that these challenges don’t excuse the unfair treatment and unfriendliness that immigrants often face when they come to the United States or other places.
Throughout the history of the United States, there have been instances of prejudice and hostility toward immigrants. Beginning with the Pilgrims, this country was built by people who came here in search of political and religious freedom and economic opportunities. However, when large numbers of immigrants arrived in the nineteenth century, they were not always welcomed with open arms (Roediger 2006). For example, around three million Irish immigrants, many of whom were Catholic, came to the United States during the first half of that century. Because they were not Anglo-Saxon Protestants like many of the native-born Americans, they faced discrimination and were even viewed as a different race. The Know-Nothing Party, made up of native-born Whites, openly opposed Irish immigrants and sometimes resorted to violent acts against them, including murders. Later immigrants from Italian, Polish, and Jewish backgrounds also faced discrimination in employment and other areas due to ethnic prejudice and hostility.
Starting with the California gold rush in 1849 and continuing after the Civil War, many Chinese immigrants came to the United States. They played vital roles in building the nation’s railroads and contributing to various other important tasks. However, they faced hostility from native-born Americans who were worried about losing their jobs to the Chinese (Pfaelzer 2008). This hostility intensified during the 1870s when the national economy was struggling, leading to riots against the Chinese in western cities. In over three hundred cities and towns, mobs of white Americans attacked Chinese neighborhoods, burning them down and killing some residents while forcing others to leave. In response to this discrimination, Congress passed a law in 1882 that banned Chinese immigration for nearly a century.
Similarly, during the 1930s, there was a growing number of Mexican Americans in the western United States, which sparked similar hostility (Daniels 2002). This was exacerbated by the Great Depression, as white Americans became increasingly concerned about losing their jobs to Mexican immigrants. White-owned newspapers spread false claims that these immigrants were violent and prone to criminal behavior, often linking it to their alleged use of marijuana. As a result, around 500,000 Mexicans either faced forced deportation or returned to Mexico due to immense pressure.
Immigration remains a significant issue for many Americans, with much of the focus centered on Mexican immigrants, even though they don’t make up the majority of all immigrants. According to political scientist Victoria M. DeFrancesco Soto (2012), this focus is often driven by racial prejudice. She explains that opposition to immigration isn’t primarily about personal economic concerns or states’ rights, but rather reflects negative attitudes towards Latinx/e Americans.
In 2021, the number of unauthorized immigrants from Mexico residing in the U.S., totaling 4.1 million, reached its lowest level since the 1990s, accounting for 39% of the nation’s unauthorized immigrant population, marking the smallest share on record (Pew Research Center 2023a). This decline in unauthorized immigrants from Mexico is attributable to several factors, including a broader decrease in migration from Mexico to the U.S., ongoing return migration of Mexican immigrants to Mexico, and increased opportunities for legal immigration from Mexico and other nations, particularly for temporary agricultural workers. Meanwhile, the overall number of unauthorized immigrants in the U.S. from countries besides Mexico has markedly increased, reaching 6.4 million in 2021, reflecting a rise of 900,000 since 2017. Notably, after Mexico, the countries with the largest unauthorized immigrant populations in the U.S. in 2021 were El Salvador (800,000), India (725,000), Guatemala (700,000), and Honduras (525,000), with India, Guatemala, and Honduras experiencing growth in their unauthorized immigrant populations since 2017 (Pew Research Center 2023a).
Roughly three-fourths of immigrants in the United States are either naturalized citizens, legal residents, or legal temporary migrants. Around one-fourth, or 28 percent, totaling about 11 million people, are undocumented residents. Among these undocumented residents, nearly 60 percent, or close to 7 million, are from Mexico. Additionally, approximately 4.5 million children born in the United States, who are citizens by birthright, have at least one parent who is an undocumented immigrant.
Undocumented immigrants make up more than 5 percent of the US workforce, totaling about 8 million workers. Households led by undocumented immigrants contributed an estimated $11.2 billion in state and federal taxes in 2010. According to the Immigration Policy Center (2012), if all undocumented immigrants were to leave the United States, the economy would suffer an annual loss of 2.8 million jobs, $552 billion in economic activity, and $245 billion in gross domestic product (GDP).
The numbers regarding jobs and the economy show that undocumented immigrants play a significant role in the U.S. economy. Surprisingly, research suggests that immigrants, whether they’re here legally or not, are less likely to commit crimes compared to people born in the U.S. (Wadsworth 2010). This lower crime rate is attributed to immigrants having strong family ties, active involvement in religious communities, and a high number of small businesses, which contribute to safer neighborhoods. However, a curious trend emerges as immigrant families spend more time in the United States, the crime rates among their descendants tend to increase. This is partly because successive generations of immigrants assimilate more into American culture, which can lead to higher crime rates (Sampson, 2008).
Despite the positive impact immigrants have on the U.S. economy and their relatively low involvement in crime, many people are against immigration. According to a survey conducted in 2010 called the General Social Survey (GSS), half of the participants believed that the number of immigrants coming to the United States should be reduced either by a small amount or by a large amount. Only about 14 percent of respondents thought that the number should be increased. In a 2011 poll by CNN, one-third of the public expressed some level of unsympathetic feelings toward illegal immigrants and their families. Additionally, in the same poll, over half of the participants supported the construction of a seven-hundred-mile fence along the border with Mexico (PollingReport.com 2012).
In recent years, several states have passed strict laws regarding immigrants, including denying schooling and various social services to unauthorized immigrant families. States like Arizona, Georgia, and Alabama have implemented some of the toughest legislation.
Arizona’s law, which was enacted in 2010, made it a crime to not carry immigration documents and required police to question and detain anyone they suspected of being an illegal immigrant. Previously, such restrictions were primarily handled by the federal government. Critics argued that this new law could lead to ethnic and racial profiling, for individuals who appeared Mexican might be disproportionately targeted by police for suspicion of being illegal immigrants (Archibold 2010). They also pointed out that the law resulted in an economic loss of $250 million during its first year due to a decline in conference and convention business in Arizona (Brown 2011).
Georgia passed a law in 2011 that gave police the authority to ask for immigration documents from people suspected of committing crimes. If someone couldn’t provide these documents, they could be held for deportation by federal officials. The law also made it harder for businesses to hire workers without proper documentation and increased the penalties for those who did. Additionally, it set penalties for anyone who housed or transported unauthorized immigrants. The Georgia Chamber of Commerce was worried about how this law would affect the economy, especially tourism. Reports suggested that if the law led to all unauthorized workers leaving Georgia, the state’s agricultural industry could lose up to $1 billion each year because most farm workers in Georgia are unauthorized immigrants (Berman 2011).
Alabama passed a law in 2011 that gave police the authority to detain individuals suspected of being unauthorized immigrants. Additionally, the law required schools to keep records of students’ immigration status and mandated that individuals applying for a driver’s license to prove their U.S. citizenship. These measures caused significant delays in obtaining driver’s licenses and led to many immigrant workers leaving the state, resulting in crops being left unharvested on farms. Business leaders worried that the law would negatively impact the state’s economy, especially after a Mercedes-Benz executive from Germany was detained by police (Ott 2012).
A study conducted several months after the law was enacted found that it prompted between 40,000 and 80,000 unauthorized workers to leave Alabama (Lee 2012). As a result, the state suffered an estimated annual GDP loss of at least $2 billion, a decrease in state revenue from income and sales taxes of at least $57 million, and a reduction in local sales tax revenue of at least $20 million. The federal government is responsible for holding and sending back unauthorized immigrants. Each year, over 360,000 immigrants are detained, usually for about three months on average, but some over a year. This detention system costs over $21 billion annually, with each detainee costing more than $60,000. Most detainees are held for minor violations like overstaying a visa, not for serious crimes, so they’re not considered dangerous to the public.
There’s ongoing debate about how much the government should deport people, but critics, including immigration judges, criticize the conditions in which illegal immigrants are detained. They argue that detainees are denied basic rights, like the right to have a lawyer appointed by the court. More than four-fifths of them don’t have any legal help, and those who do often get inadequate assistance (Semple 2011).
Another issue regarding immigration involves battered women who are immigrants (Constable 2012). When women experience abuse from their husbands or partners, it’s often hard for them to escape the situation. Many of them are only allowed to stay in the United States because their husbands are legal residents or citizens. They fear being deported if they seek help from the authorities and their husbands are deported. Similarly, abused immigrant women who are in the United States illegally also fear deportation if they seek assistance from the police. Fortunately, there’s now a federal law that allows abused immigrant women to apply for legal residency, but many women aren’t aware of this option.
Despite highlighting various flaws in U.S. immigration policy, it’s worth noting that the United States is relatively favorable towards immigrants compared to many other countries. More detailed information on this international comparison is provided below.
LEGAL IMMIGRANTS IN WESTERN DEMOCRACIES
The Migrant Integration Policy Index (MIPEX) is a project by the British Council and the Migration Policy Group, which is a global partnership. This index evaluates the United States, Canada, and twenty-eight European nations regarding how well legal immigrants are integrated into the political and economic aspects of each country and their journey toward full citizenship. It also assesses the presence of anti-discrimination laws in each country to safeguard immigrants. MIPEX comprises a total of 148 policy indicators. In the most recent (2011) MIPEX report, the United States ranked ninth among the thirty-one countries on this index. Sweden claimed the top position, followed by Portugal and Canada. A news report summarized one of the main discoveries of the study by noting that “strong U.S. antidiscrimination laws protect immigrants and guarantee them equal rights and opportunities, a model for immigration rules elsewhere.” MIPEX also highlighted the United States’ favorable rankings concerning legal immigrants’ access to employment, education, and family reunification opportunities.
However, the MIPEX report also pointed out areas where the United States falls short. Many immigrants are denied certain federal benefits, and there are substantial fees associated with specific immigration processes. Additionally, U.S. immigration laws are deemed overly intricate, with limited availability of visas. These shortcomings contributed to the United States lagging behind other nations with higher scores on the index. In response to the MIPEX report, the director of the Immigration Policy Center in Washington, DC, emphasized the need for the United States to enhance efforts in immigrant integration, such as providing better support for English language learning. She also cautioned against potential reductions in federal and state budgets, which could negatively impact the U.S. ranking. Although the United States holds a relatively high position among global democracies concerning the status of its legal immigrants, the superior status of immigrants in countries like Canada suggests areas for improvement and provides guidance for enhancing the U.S. ranking and fostering a more welcoming environment for immigrants.
Huddleston, Tom and Jan Niessen. 2011. Migrant Integration Policy Index III. Brussels, Belgium: British Council and Migration Policy Group.
Restrepo, M. 2011. “International Study Points Out U.S. Immigration Policy Successes, Failures.” The American Independent.
